
As part of the Data & Insights solution, Vetsource provides practice performance reports, dashboards, and automated marketing solutions for veterinary practices. They make sense of complex veterinary data and turn it into actionable information. With an abundance of metrics available, Sheri is here to help explain how to choose the right KPIs to fully assess practice performance.
What metrics are practices typically looking at?
I usually hear the same set of KPIs: revenue, new clients, ACT, active clients, percentage of revenue toward cost of goods, and percentage of revenue toward labor. I consistently get the same answers even though practices are vastly different and often have different goals.
What metrics should practices be measuring and analyzing?
We recommend that practices monitor metrics that provide the most relevant information based on what they're trying to accomplish. Each team member should understand why they're looking at a certain KPI and, more importantly, they need to know what to do with the information. Each metric should help tell the story of their progress toward a specific goal.
Can you give us an example of what practices typically measure?
Sure. Let's say a practice has a goal to provide more services (better care) to more patients. Typically you'll see that practice measuring ACT (Average Client Transaction) and the number of invoices to get a sense of this. ACT is the average dollar amount of all invoices generated at the practice or the average amount clients spend each time they visit. Now, I’m not suggesting that the practice should not track ACT, but this metric alone will not tell them the full story of how they are performing against their goal of better care.
Let’s look at an example practice:
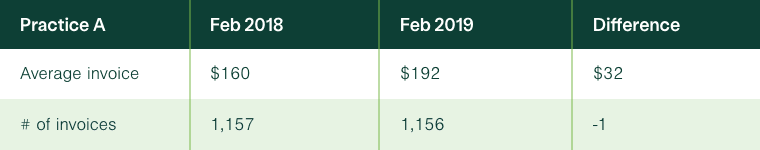
Looking at the metrics above, this practice’s ACT is $32 more than it was for the same month last year, which is a 20% increase. However, the number of invoices generated was flat to last year. Given this data alone, you might assume that this practice is providing more services to the same number of patients. But how many of these invoices were for a unique patient? Pharmacy refills, retail purchases, and multiple visits from the same patient will skew that number. If a patient was seen multiple times for the same condition or had $0 transactions—like a suture removal—ACT will be affected. ACT alone is simply not telling the full story.
Are there metrics that provide a more detailed picture?
Yes. We recommend that practices measure the number of unique patients that visit each month and the average revenue generated from each unique patient. To calculate revenue per unique patient, add the total revenue from all transactions for each unique patient during the month. Then divide that by the number of unique patients that visited the practice. Regardless of how many times a patient visited the practice in one month, they should be counted only once.
For example, client A brings Fluffy in every day of the month for subcutaneous fluids. Each visit is $40. We count Fluffy only once as one unique patient and then take the $40 for each visit and multiply it by 30 visits, or $1,200 of revenue. As one unique patient, Fluffy has contributed $1,200 toward revenue. If you do this for all patients practice-wide and take the average, you'll end up with a meaningful metric of revenue per unique patient to compare to your total unique patients.
For example:
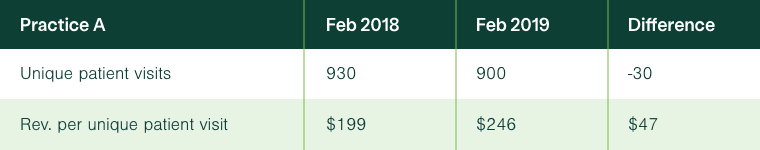
So this practice saw 30 fewer unique patients compared to the same month last year, which is a 3% decline in patients. Yet on average, they earned $47 more per unique patient that month. These metrics certainly tell a different story around whether the practice is caring for more pets or providing more care for each pet.
Can you give us another example?
Sure thing. Let's look at the following two graphs, which can be found in the Practice Overview Report from Vetsource.
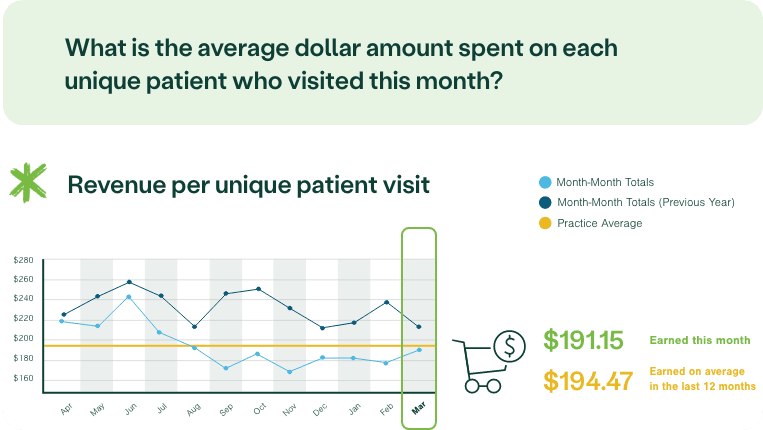
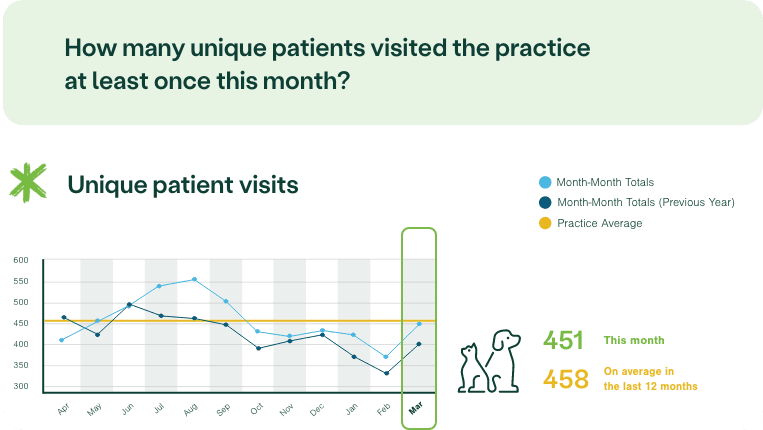
In the first graph, we see that year over year this practice is steadily increasing the number of unique patients that visit the practice each month. However, in the second graph, we see that the average revenue from each unique patient is consistently lower compared to last year. For both graphs, the blue line is this year, the black line is last year. In Sept and Oct of this year, this practice earned roughly $70 less per patient than the prior year.
The real story: this practice is working harder for less money. With the increase in patients, perhaps they are spending less time on client education or they might be missing charges. These two metrics allow the practice to more accurately identify where they are falling short of their goals and then take action.
Measuring the right metrics is incredibly important. Any final thoughts for practices?
Think about what matters most to your practice and define specific goals. Then you can determine which KPIs best answer how you are performing against your goals. If you want to care for more patients, track your net change in active patients and unique patient visits. If you want to provide better care overall, track revenue per unique patient across various service categories like the ones outlined in the AAHA/VMG Chart of Accounts. Compliance and other non-financial metrics are also important to consider. Know what your goals are, ask the right questions, and use data to build a strategy to achieve success.
Sheri Gilmartin, CVT is VP of Data Services for Vetsource. ezyVet is proud to partner with Vetsource for practice analytics.